
How to Read and Interpret Forex Charts Like a Pro
Forex trading is a complex yet rewarding financial endeavor. At the heart of successful trading lies the ability to read and interpret forex charts effectively. If you’re new to trading or looking to sharpen your chart analysis skills, this guide will help you navigate forex charts like a pro.
Understanding Forex Charts
A forex chart is a graphical representation of the price movement of currency pairs over a specified period. Traders use these charts to analyze trends, identify trading opportunities, and make informed decisions. There are three main types of forex charts:
1. Line Charts
A line chart connects closing prices over a period, providing a simple and clear view of price trends. This type of chart is ideal for beginners as it eliminates market noise and focuses solely on closing prices.
2. Bar Charts
A bar chart provides more details by displaying the opening, closing, high, and low prices for each time period. Each bar represents price fluctuations within a specific timeframe, helping traders analyze market volatility.
3. Candlestick Charts
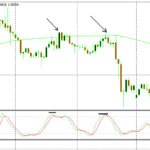
Candlestick charts are the most popular among traders due to their visual appeal and comprehensive information. Each candlestick shows the opening, closing, high, and low prices. Different candlestick patterns can signal potential trend reversals or continuations.
Key Components of a Forex Chart
To interpret forex charts effectively, you need to understand the following elements:
1. Timeframe Selection
Forex charts can be set to various timeframes, ranging from minutes to months. Shorter timeframes (e.g., 1-minute, 5-minute charts) are useful for day traders, while longer timeframes (daily, weekly charts) are beneficial for swing traders and investors.
2. Price Action
Price action refers to the movement of a currency pair over time. By analyzing price action, traders can identify trends, support and resistance levels, and potential breakout opportunities.
3. Trend Identification
Recognizing trends is crucial in forex trading. Trends can be:
- Uptrend: A series of higher highs and higher lows.
- Downtrend: A series of lower highs and lower lows.
- Sideways (Range-bound): Price moves within a horizontal range.
4. Support and Resistance Levels
- Support is a price level where demand is strong enough to prevent further decline.
- Resistance is a price level where selling pressure prevents further price increases.
These levels help traders determine entry and exit points for trades.
Technical Indicators for Forex Chart Analysis
While price action is fundamental, traders often use technical indicators to confirm signals. Some commonly used indicators include:
1. Moving Averages (MA)
Moving averages smooth out price data to identify trends. The two most common types are:
- Simple Moving Average (SMA): An average of past closing prices.
- Exponential Moving Average (EMA): Places more weight on recent prices for quicker trend identification.
2. Relative Strength Index (RSI)
RSI measures the strength of a currency pair’s price movement on a scale of 0 to 100. Values above 70 indicate overbought conditions, while values below 30 indicate oversold conditions.
3. Bollinger Bands
Bollinger Bands consist of a moving average with upper and lower bands. When prices move outside the bands, it may indicate overbought or oversold conditions, signaling potential reversals.
4. Fibonacci Retracement
Fibonacci retracement levels help identify potential support and resistance levels based on historical price movements. Traders use these levels to anticipate pullbacks and trend continuations.
Reading Forex Charts Like a Pro
Now that you understand the fundamentals, here’s how to analyze forex charts effectively:
- Determine the Trend: Use moving averages and trend lines to identify market direction.
- Look for Key Levels: Identify support and resistance levels for potential trade setups.
- Analyze Candlestick Patterns: Recognize reversal or continuation patterns such as Doji, Engulfing, or Hammer candles.
- Use Technical Indicators: Apply RSI, Bollinger Bands, or Fibonacci levels to validate your analysis.
- Monitor Economic Events: Stay updated on economic news, as major events impact currency movements.
- Practice with Demo Accounts: Before trading with real money, practice your chart analysis skills on a demo account to gain confidence.
Final Thoughts
Mastering forex chart analysis takes time, practice, and continuous learning. By understanding different chart types, identifying trends, and utilizing technical indicators, you can develop a strategic approach to forex trading. Keep refining your skills, stay informed about market developments, and approach trading with discipline for long-term success.